Citation: “IMPORT OF VIRGINIA TOBACCO INTO NEW YORK.” The Merchants’ Magazine and Commercial Review, Volume 18, no. 2, (1848): 211. Proquest.
Airtable: https://airtable.com/appLbtwquSeojHpnI/shrh75uB9441qPCmZ
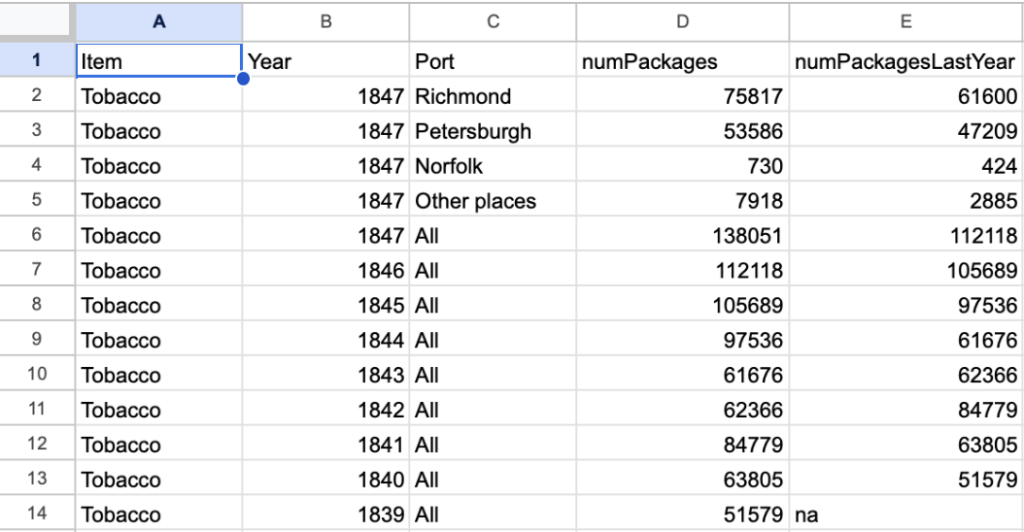
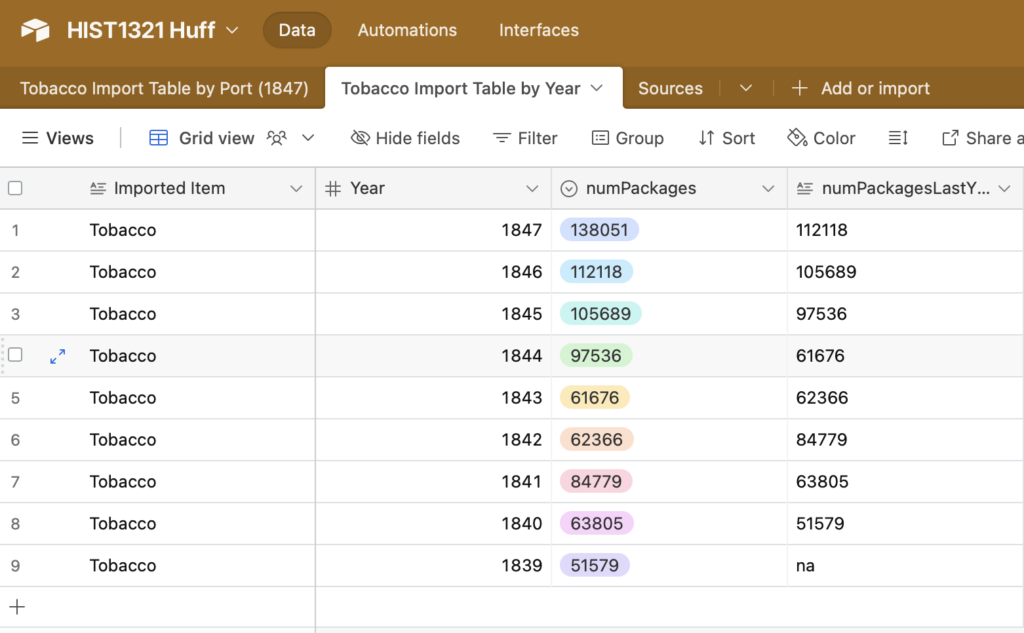
I selected the Source “IMPORT OF VIRGINIA TOBACCO INTO NEW YORK” because it has various data on tobacco exports from Virginia both geographically and chronologically. I chose this because my topic is tobacco trade in the mid-atlantic region in early america. This data is recorded from all of Virginia in the 1830s and 1840s. While it only covers a short period of time and one state, Virginia was a very influential state in the tobacco trade. When I created my first google spreadsheet, I tried to put every piece of data in it in one table. This was a mistake because the data came from two separate tables, and although being on the same topic, were representing different things. I combined the data from 1 year but different places with data from different years and all of the places combined. If I was to create a visualization, it wouldn’t have much meaning because different data points would be representing completely different things. Transcribing structured data has multiple disadvantages. While my data set was small, it still does take way more time copying each cell. If it was a larger dataset, this would cause lots of tedious work that would take a lot of time. Another issue with transcribing structured data is misinterpretation. Handwriting can be misread/ confusing to determine what is written, which may cause an error in the transcription process. Transcribing a text document is easier because oftentimes you can import the file which take seconds. There is also no room for error when importing a file except for formatting issues, which can usually be fixed easily. I took advantage of importing data into my database. I downloaded my google sheet as a csv file, which I then imported into Airtable. This process took a few minutes, which is very efficient. On my database, I split my sheet into two tables that I had described earlier (geographically and chronologically). I also added another table that I will add to in the future with the sources I use for any other tables. With the small dataset, I only had one anomaly, which was an unknown amount of packages for the prior year. All of this considered, I think that the data I have gathered and formatted will be of good use for making visualizations of tobacco trade in the mid-Atlantic region of Early America.
Leave a Reply